Experienced KS1 and KS2 teacher currently teaching in Year Six. Specialist Leader for Mathematics across three Local Authorities.
All resources have been tried and tested. I'm open to suggestions and requests and aim to help anyone who requires it.
Please leave feedback and rate my resources.
Experienced KS1 and KS2 teacher currently teaching in Year Six. Specialist Leader for Mathematics across three Local Authorities.
All resources have been tried and tested. I'm open to suggestions and requests and aim to help anyone who requires it.
Please leave feedback and rate my resources.
- Calculate the area of quadrilaterals including squares, rectangles, trapeziums and parallelograms.
- Calculate the area of triangles
- Calculate the area of compound shapes, including shapes with missing lengths and decimal sides.
Differentiated. Now includes a PowerPoint and pdf to help with teaching and display (found in the quadrilaterals section)
Fun, fully interactive and challenging with working 50/50 lifelines. An excellent way to assess or embed skills.
There are 15 questions, testing children's ability to multiply and divide by 10, 100 and 1000 (including decimals).
N.B The original logos for Who Wants to be a Millionaire are property of Sony Pictures Television. For this reason they have not been included, but a similar non-trademarked version has.
Please leave feedback.
These are excel spreadsheets Gap Analysis documents for the May 2016 Year Six SATs Papers for GPS (including spelling).
The sheet totals up the scores automatically and each child’s final score changes colour to reflect their ability.
If their total score for a subject goes green, it means they would have passed the 2016 SATs with that score. If it goes Orange, it means they are within touching distance. If it goes Green with a yellow font, it means that child would have achieved a ‘More Able’ score for that tested subject.
I have also included a digital document, linking to a freely available copy of each test, mark scheme and instructions. Additionally, I have included the conversion tables from RAW Score to Scaled Score.
All a teacher has to do is enter their children’s names and enter the 0’s, 1’s, 2’s or 3’s for each question, which also change colour too for a visual reference. I recommend that a teacher should enter ‘N’ if a child did not attempt that question. This gives an idea of who is not even attempting certain questions, not just whether they got the question wrong.
The sheets are set up for 30 pupils but more can be added/deleted and instructions are on the first page/sheet. Some cells are locked/protected in this document but the parts that you need to insert yourself are editable. This is so that the formulas/algorithms do not break and render the spreadsheet’s functionalities as broken.
I take requests for Gap Analysis Grids. Please leave feedback if you like this resource as I am planning to produce more for each SATs paper going forward, as well as CGP Practice Papers.
Please remember to rate this resource as I made this to save teachers time. Thank-you.
These are excel spreadsheets Gap Analysis documents for the May 2019 Year Six SATs Papers for Maths (Arithmetic, Reasoning 1 and Reasoning 2).
**The sheet totals up the scores automatically and each child’s final score changes colour to reflect their ability.
If their total score for a subject goes green, it means they would have passed the 2019 SATs with that score. If it goes Purple with a white font, it means that child would have achieved a ‘More Able’ score for that tested subject.**
I have also included an instructions and document page, linking to a freely available copy of each test, mark scheme and instructions. Additionally, I have included a link to the conversion tables from RAW Score to Scaled Score.
All a teacher has to do is enter their children’s names and enter the 0’s, 1’s, 2’s or 3’s for each question, which also change colour too for a visual reference. I recommend that a teacher should enter ‘N’ if a child did not attempt that question. This gives an idea of who is not even attempting certain questions, not just whether they got the question wrong.
The sheets are set up for 30 or 90 pupils but more can be added/deleted and instructions are on the first page/sheet. Some cells are locked/protected in this document but the parts that you need to insert yourself are editable. This is so that the formulas/algorithms do not break and render the spreadsheet’s functionalities as broken. This password will not be given out, but I am more than happy to make adaptations or changes for you, provided you show proof of purchase. All of my contact details are in the resource.
I take requests for Gap Analysis Grids. Please leave feedback if you like this resource as I am planning to produce more for each SATs paper going forward, as well as CGP Practice Papers.
Please remember to rate this resource as I made this to save teachers time. Thank-you.
This resource is intended to be used to help teach the skills of the KS2 National Curriculum for Reading, by domain. Domains 2b and 2d are weighted more in these comprehensions to match the weighting of the end of KS2 Reading Comprehension assessment.
Included:
• SATs style comprehension questions for the prologue/preface and the twenty-seven chapters of the novel.
• A teaching PowerPoint with an introduction to the author, their other works and copies of the questions.
This resource works best if the chapter is read, talked about and discussed in one day, then comprehension questions are given the day after.
This resource has been used with both Year Five and Year Six classes to great effect and has boosted their reading skills and their comprehension scores.
Please let me know if you found this resource useful. It should save you hours and hours of time.
This resource will save you many hours work when trying to use Assessment for Learning in your class.
There are two QLA grids included in one Excel document for help with Gap Analysis.
Arithmetic
Reasoning
Input the data using the marks from the papers and the grid will change colour to show where a child has been successful or not answered a question correctly, or at all.
The spreadsheet will auto-calculate how successful the whole cohort has been on particular questions. These are linked directly to the WRM small steps so you can see which lessons and steps need to be revised. 30 children can be entered in this document.
The total score thresholds auto-calculate and change colour to help indicate which children are working at approximately an expected standard (EXS) level or a Greater Depth (GDS) level. These thresholds use historical KS2 SATs thresholds to make them as accurate as possible.
Please note, some of the cells are locked for editing so that users do not break the spreadsheet functionality. Passwords will not be given out. However, I am more than happy to assist with any adaptations you need.
Additionally, I am in no way affiliated with White Rose Maths. No White Rose Maths resources are included in this product. Freely available content is linked to within it.
A page of blank cards that can be cut out, laminated and written on with whiteboard marker. Coloured green to match VCOP colouring for conjunctions.
I use these as visual prompts on all my working walls.
These are excel spreadsheets Gap Analysis documents for the May 2016 Year Six SATs Papers for Reading .
The sheet totals up the scores automatically and each child’s final score changes colour to reflect their ability.
If their total score for a subject goes green, it means they would have passed the 2016 SATs with that score. If it goes Orange, it means they are within touching distance. If it goes Green with a yellow font, it means that child would have achieved a ‘More Able’ score for that tested subject.
I have also included a digital document, linking to a freely available copy of each test, mark scheme and instructions. Additionally, I have included the conversion tables from RAW Score to Scaled Score.
All a teacher has to do is enter their children’s names and enter the 0’s, 1’s, 2’s or 3’s for each question, which also change colour too for a visual reference. I recommend that a teacher should enter ‘N’ if a child did not attempt that question. This gives an idea of who is not even attempting certain questions, not just whether they got the question wrong.
The sheets are set up for 30 pupils but more can be added/deleted and instructions are on the first page/sheet. Some cells are locked/protected in this document but the parts that you need to insert yourself are editable. This is so that the formulas/algorithms do not break and render the spreadsheet’s functionalities as broken.
I take requests for Gap Analysis Grids. Please leave feedback if you like this resource as I am planning to produce more for each SATs paper going forward, as well as CGP Practice Papers.
Please remember to rate this resource as I made this to save teachers time. Thank-you.
Included are two activity sheets/worksheets where children need to count up in steps of five and ten.
- Lower ability (first three numbers given, the rest relies on counting on)
- Higher Ability (sequence of eight numbers, some missing, where children will need to count on and back in order to solve the problem).
Included are two activity sheets/worksheets where children need to count up and back in number sequences
- Lower ability (first three numbers given, the rest relies on counting on in 2, 3, 5 etc)
- Higher Ability (sequence of eight numbers, some missing, where children will need to count on and back in order to solve the problem).
Included are two activity sheets/worksheets where children need to count up in steps of two.
- Lower ability (first three numbers given, the rest relies on counting on)
- Higher Ability (sequence of eight numbers, some missing, where children will need to count on and back in order to solve the problem).
Editable differentiated data handling activity for KS1 children or lower KS2 children.
Activity 1 - children complete a tally chart (in this instance, number of letters in their classmates' names - this is editable)
Activity 2 - Create a bar chart from their data.
Lower Ability - Axes are labelled
Higher Ability - Axes are not labelled
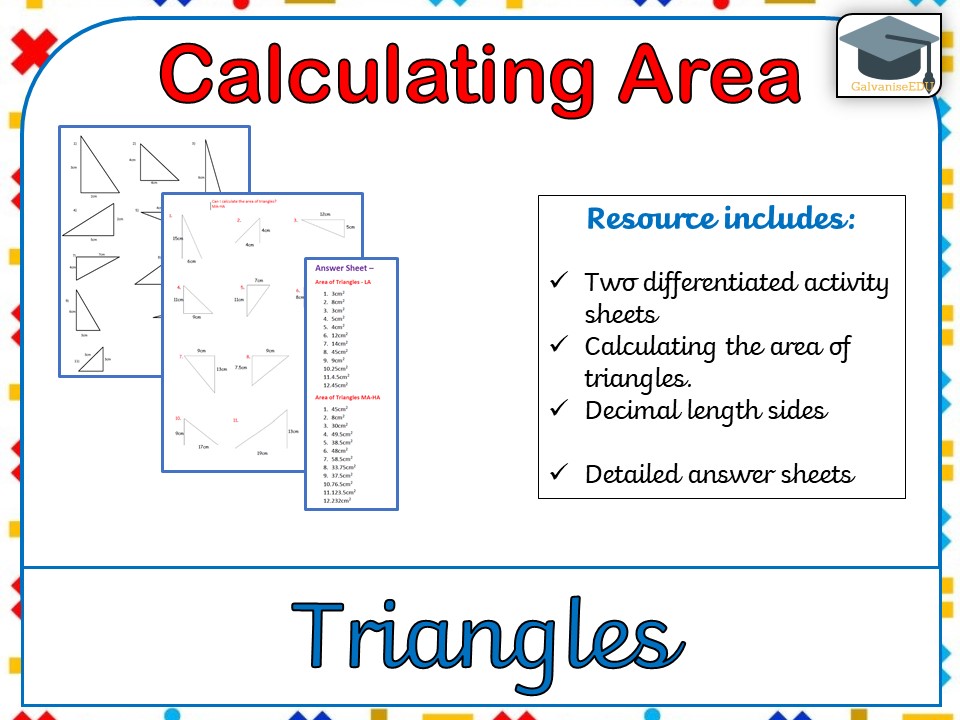
Two differentiated sheets for KS2 children whose aim is to calculate the area of triangles.
Activity Sheet 1 - Triangles with whole number length sides, easier lengths.
Activity Sheet 2 - Triangles with challenging length sides, including decimals. Short/Long multiplication skills will be required.
Answer Sheet - Answers for both activities.
I have included PDF versions and Word Document versions for those of you who may want to edit the activity sheets for your own children’s needs.
Please visit my shop for other differentiated Maths resources.
Perfect for meeting the requirements of KS2.
- Find missing angles in right angles
- Find missing angles on a straight line
- Find missing angles around a point
- Find missing opposite angles
- Calculate interior/exterior angles of polygons
-Name, calculate and measure using a protractor
Huge saving!
This is a differentiated worksheet to help children master opposite angles. Answers are included.
Children are challenged to:
- name the type of angle a ‘missing angle’ is.
- calculate its size in degrees
- measure it accurately using a protractor.
All angles are correctly sized.
There are two sheets, an Expected Standard sheet and a more challenging Greater Depth sheet (2016+ Curriculum). On each sheet there are nine missing angles, meaning that children have 27 things to do in order to complete one activity sheet.
Please rate and/or comment. All feedback is valuable.
A bundle that has:
-Angles of quadrilaterals, triangles, around a point, opposite and in right angles!
-Area of quadrilaterals, compound shapes and triangles.
-Identifying and calculating parts of a circle
-Calculating interior and exterior angles of polygons
-Who Wants to Be a Millionaire Game
-Nets for 15 different 3D shapes!
A 4-way differentiated activity sheet/worksheet that will develop children's understanding of rounding to the nearest hundred or thousand.
Challenges include:
Challenge 1 - Use a pre-made numberline to help you round the following numbers to the level of accuracy in the brackets.
Challenge 2 - Draw a place value grid or numberline to help you round the following numbers to the level of accuracy in the brackets.
Challenge 3 - Draw a number line that goes from 0 to 10,000. Indicate, with a labelled arrow, where the following numbers are placed.
Challenge 4 – Worded Problem
Answer sheet included, as well as an editable version so you can adapt to your own class.
A two-way differentiated activity sheet/worksheet that will develop the children’s understanding of line graphs, data handling, averages and data handling vocabulary.
Sheet 1 - 8 Questions asking about the warmest/coldest months, difference in temperature between months. There are two data sets on the graph (two lines, same axes)
Sheet 2 - 8 Questions focusing more on averages and trends. There are three data sets on the same axes. Completely different questions.
Answers are provided for both sheets. I have provided two different layouts which also add to the challenge. One has a wider line graph set, the other has a narrower set. This will test children’s adaptability to varying presentations.
A two-way differentiated activity sheet/worksheet that will develop the children’s understanding of bar graphs, data handling, averages and data handling vocabulary.
Sheet 1 - 8 Questions asking about the warmest/coldest months, difference in temperature between months. There are two data sets on the graph (two lines, same axes)
Sheet 2 - 8 Questions focusing more on averages and trends. There are three data sets on the same axes. Completely different questions.
Answers are provided for both sheets. I have provided two different layouts which also add to the challenge. One has a wider line graph set, the other has a narrower set. This will test children’s adaptability to varying presentations.